Evaluate the results
This guide illustrates how to view the results of the benchmark.
Viewing the Kibana dashboards
In order to view the dashboards you should have installed the Logging subsystem of KOBE.
After all pods are in Running state Kibana dashboards can be accessed at
http://<NODE-IP>:<NODEPORT>/app/kibana#/dashboard/
where <NODE-IP> the IP of any of the Kubernetes cluster nodes and <NODEPORT>
the result of
kubectl get -o jsonpath="{.spec.ports[0].nodePort}" services kibana-kibana
There are three available dashboards, which can be shown below.
Details of a specific experiment execution
The first dashboard focuses on a specific experiment execution. It comprises:
- Time of each phase of the query processing for each query of the experiment.
- Total time to receive the complete result set for each query of the experiment.
- Number of sources accessed for each query of the experiment.
- Number of returned results for each query of the experiment.
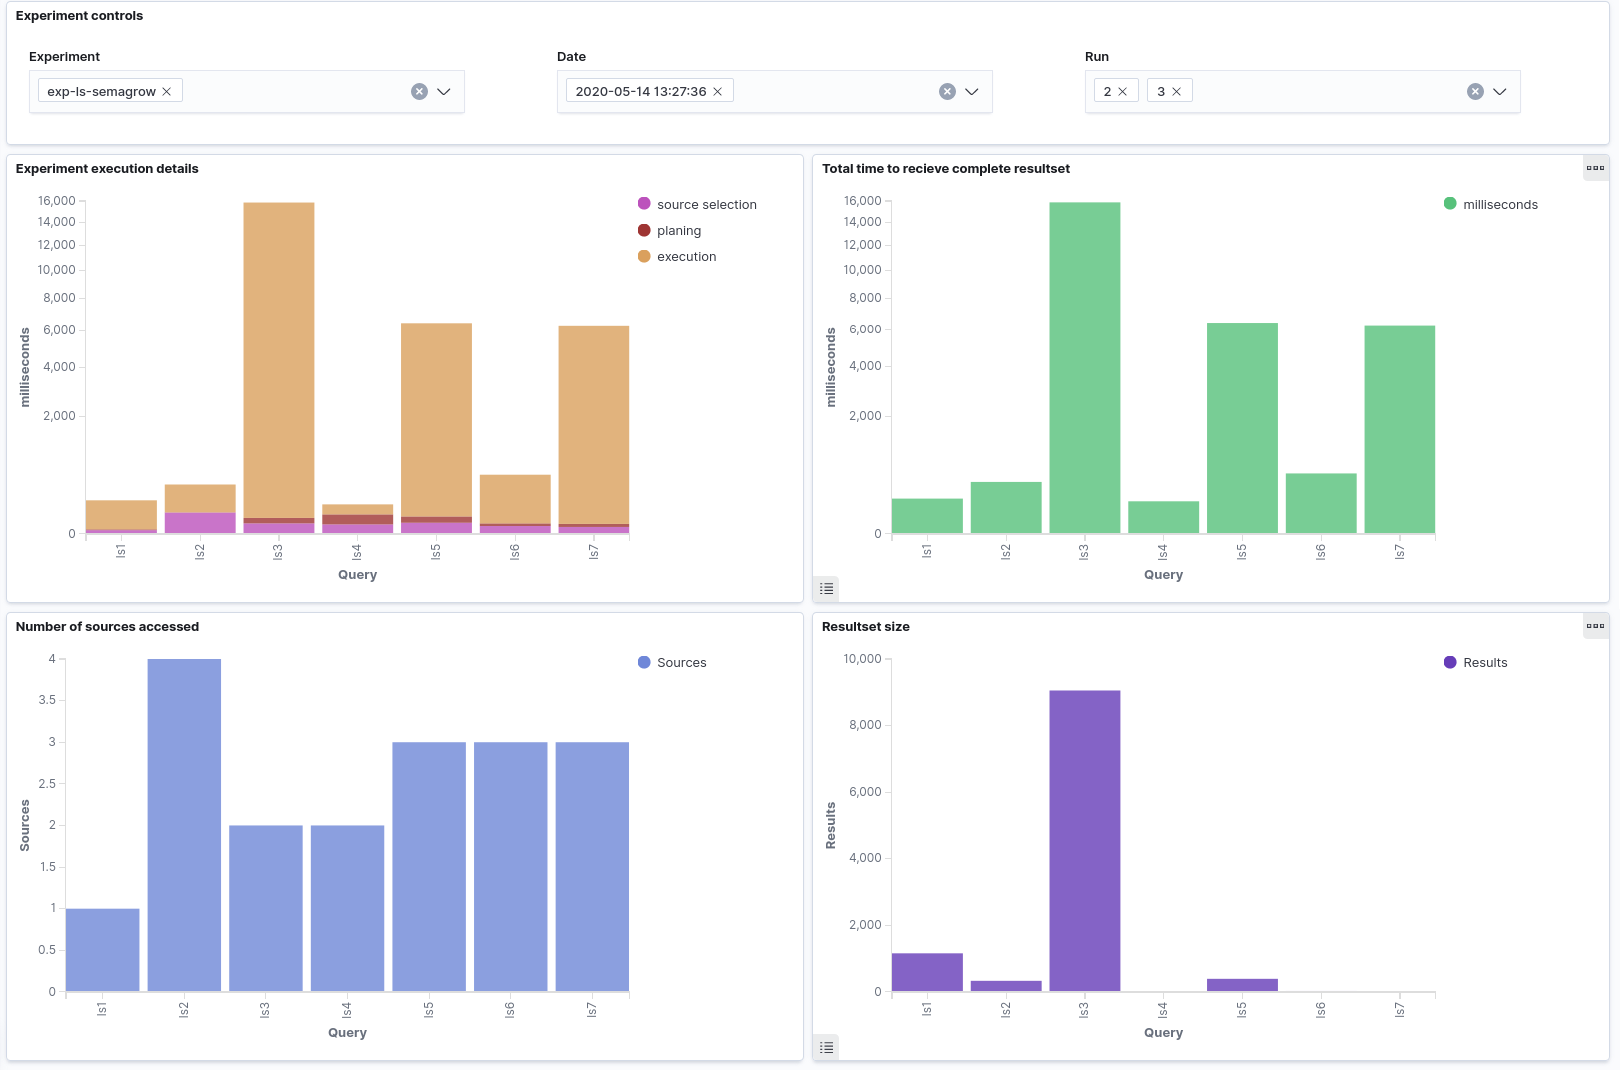
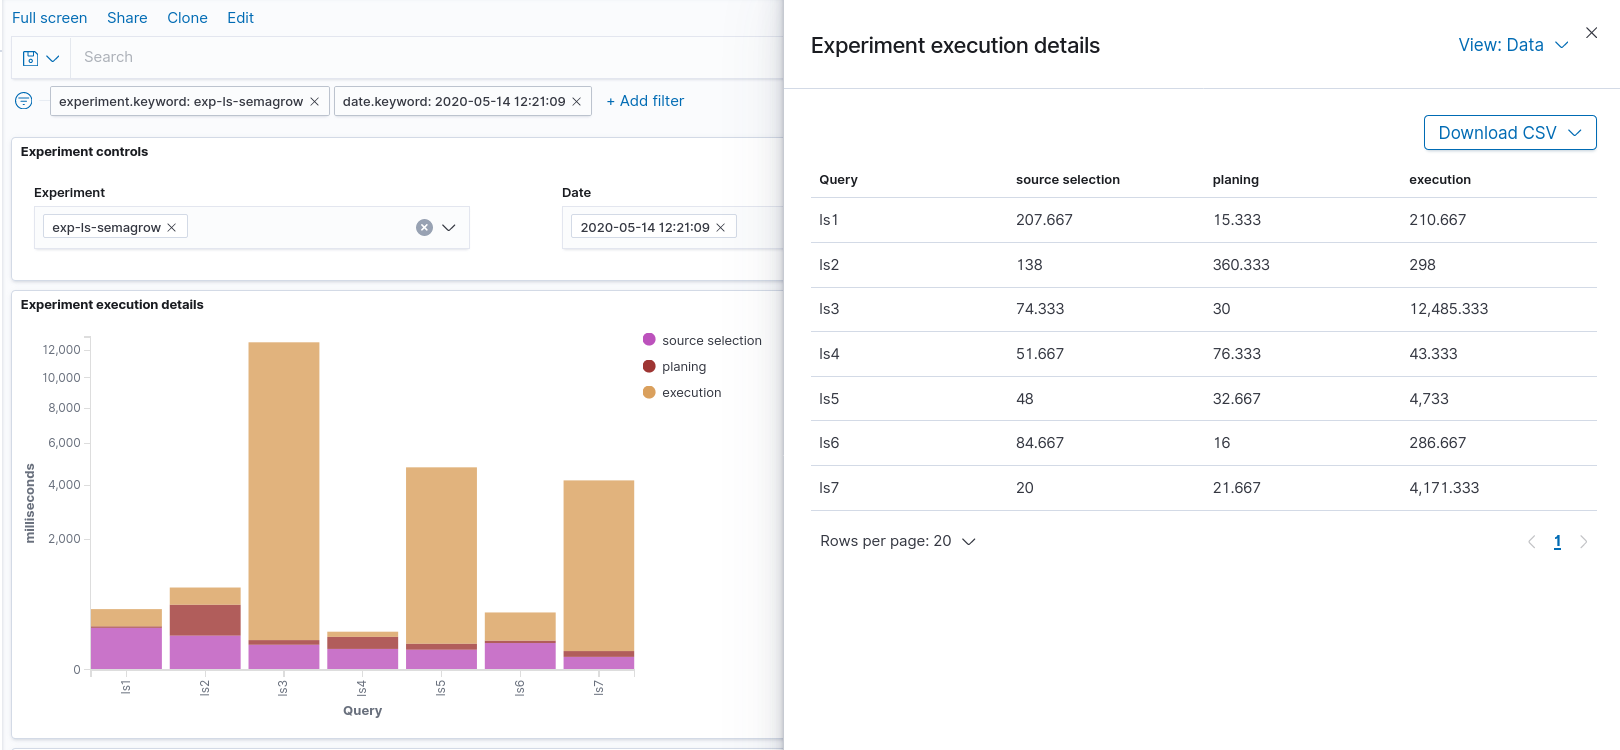
The first and the third visualizations are obtained from the logs of the federator engine, if available. The second and the fourth visualizations are obtained from the logs of the evaluator, so they are available even for federators that do not provide KOBE-specific logs. The values in each visualization can be also exported in a CSV file for further processing.
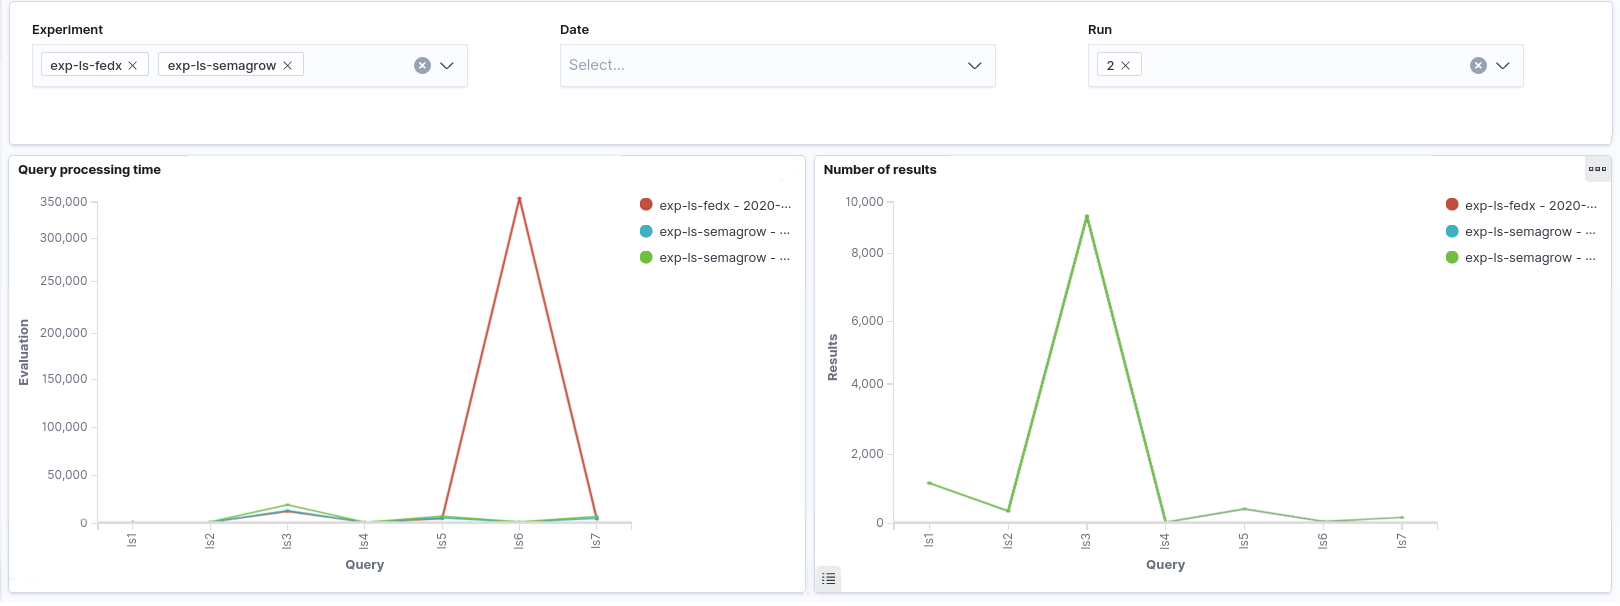
Comparisons of experiment runs
The remaining two dashboards can be used to draw comparisons between several experiment runs in order to directly compare different configurations of a benchmark. The following dashboard can be used for comparing several experiment executions. It consists of two visualizations:
- Total time to receive the complete result set for each experiment execution.
- Number of returned results for each specified experiment execution.
Each bar refers to a single query of the experiments presented.
Finally, the last dashboard displays plays the same metrics. The main difference though, is that it focuses on a specific query and compares all runs of this query for several experiment executions. Contrary to the visualizations of the other two dashboards, each bar refers to a single experiment run, and all runs are grouped according to the experiment execution they belong.
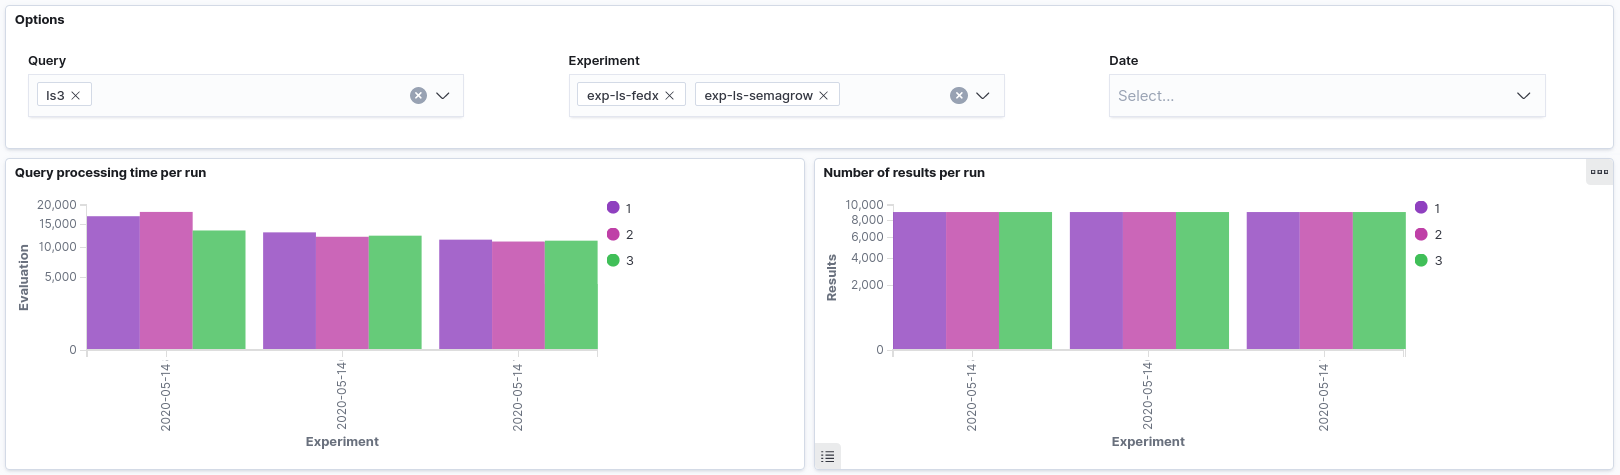
These visualizations are obtained from the logs of the evaluator.